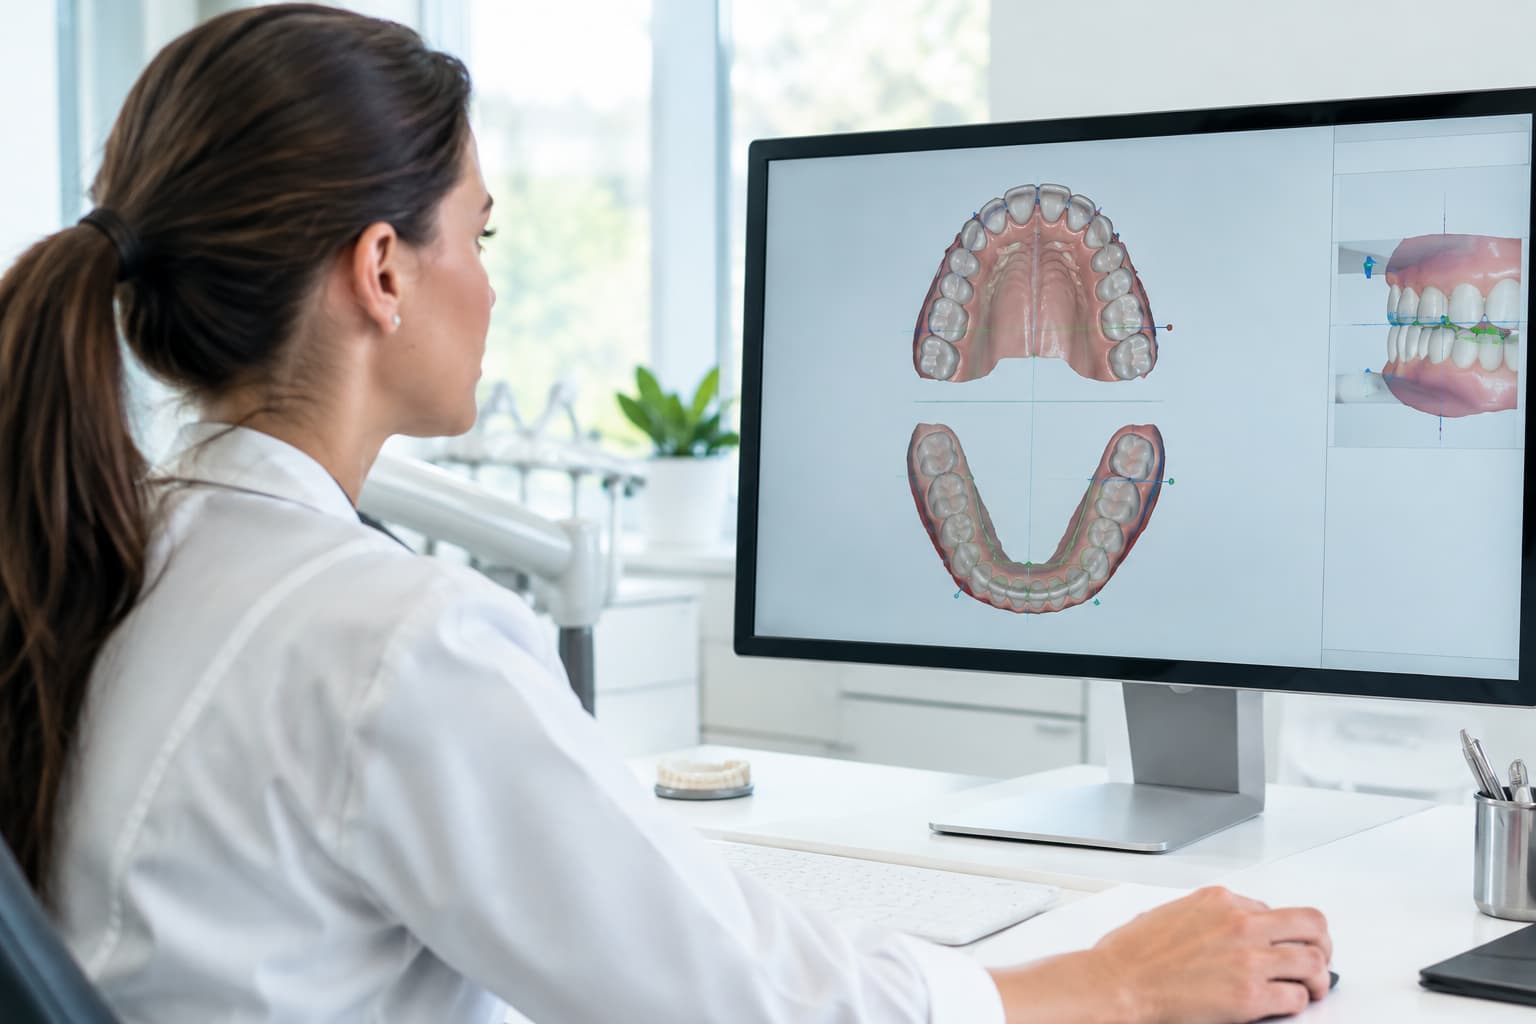
Digital model analysis moves the classic study-cast measurements (tooth widths, arch length, crowding, overjet, overbite) onto a 3D mesh from an intraoral scan. Across systematic reviews, the differences from plaster-model measurements are small enough to be clinically insignificant for most parameters, and the analysis runs faster. The caveats sit in specific places: some widths, CBCT-derived models, automated tools and poor mesh quality. This guide covers what you can measure, what the accuracy data says, and what your files must contain.
| Measurement | What it tells you | Benchmark to know |
|---|---|---|
| Bolton anterior ratio | Upper-to-lower tooth-size balance, canine to canine | 77.2 ± 1.65% |
| Bolton overall ratio | The same balance, first molar to first molar | 91.3 ± 1.91% |
| Arch length discrepancy | Available arch perimeter minus the space the teeth need | Negative value = crowding |
| Little's Irregularity Index | Lower anterior crowding in mm | 1–3 mm minimal, 10 mm+ very severe |
| Overjet and overbite | Sagittal and vertical incisor relationship | Measured per case |
| Arch widths (Pont, Korkhaus) | Transverse dimensions against values predicted from upper incisor widths | Compare predicted with measured |
What a digital model analysis covers
The analysis runs on the same logic as a plaster-cast workup. The software lets you mark each tooth's mesiodistal width, then calculates the indices. Programs such as OrthoAnalyzer, OnyxCeph, LaonSetUp and DDP-Ortho are named in the published literature for this work. No single source shows that one program handles every analysis above, so check a module list before you buy.
Four calculations do most of the work:
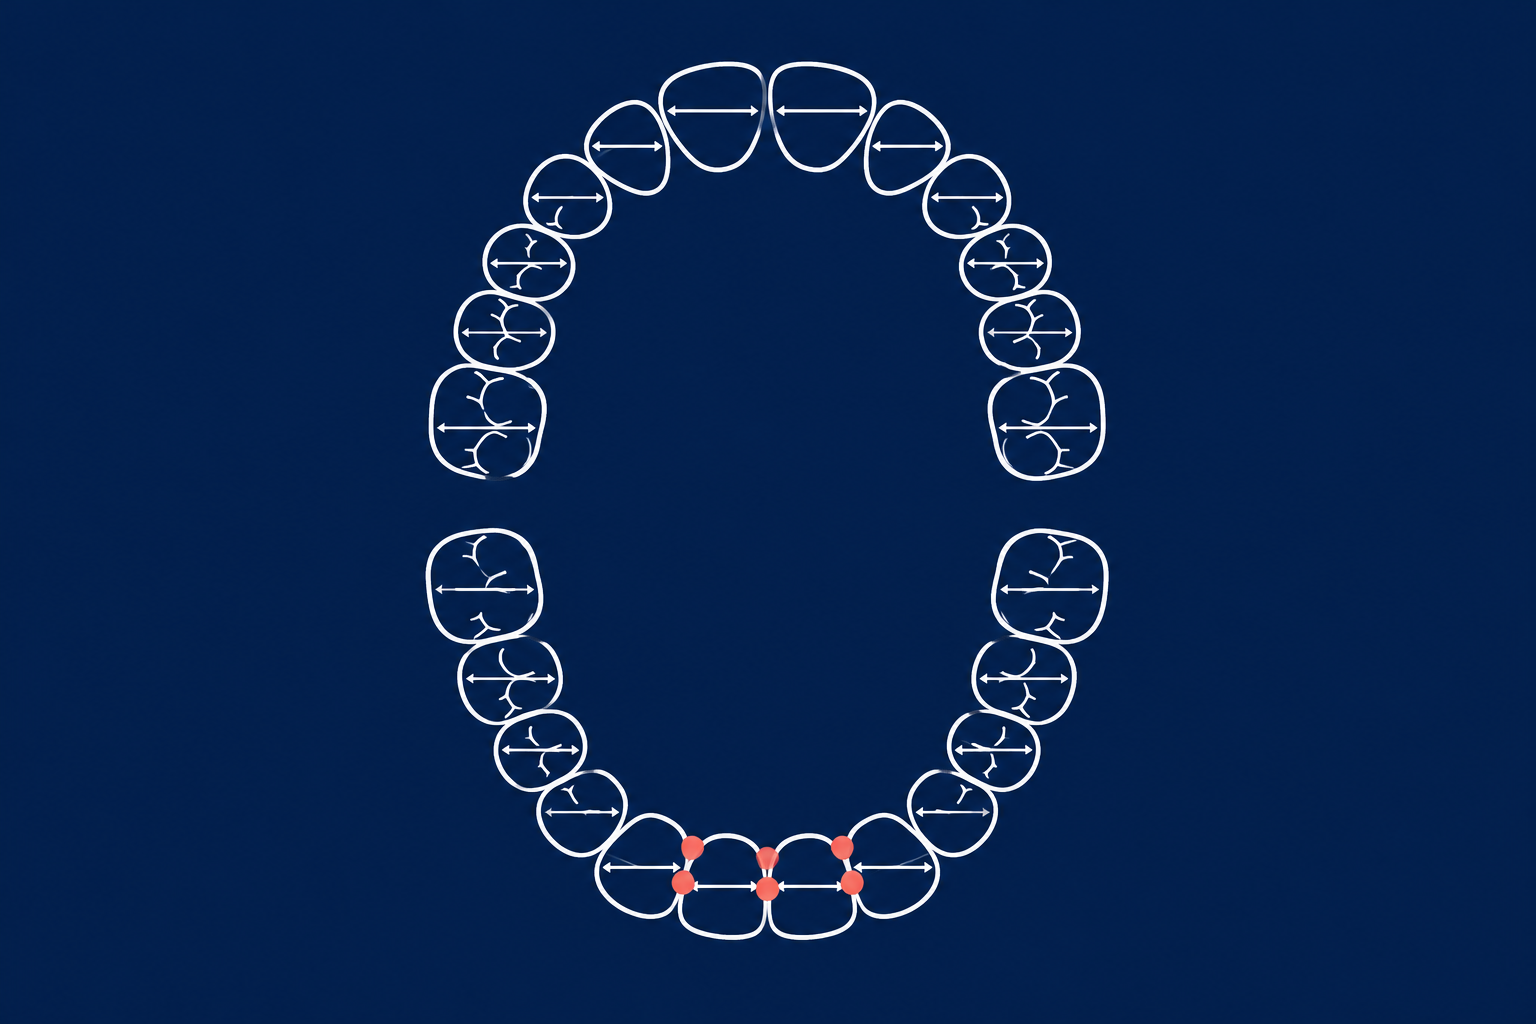
- Tooth-size ratios (Bolton): the summed width of the lower teeth divided by the upper teeth, as a percentage.
- Space analysis: arch length discrepancy is the available arch perimeter minus the required perimeter. On a digital model, the arch length is typically traced along a constructed arch form from the mesial of one first molar to the other.
- Alignment: Little's index sums the displacement between adjacent contact points of the six lower anterior teeth.
- Occlusion: overjet and overbite, which some programs calculate in two clicks once the models are in occlusion.
How accurate are digital measurements?
Accurate enough for diagnosis, with a few known exceptions. A systematic review of 17 studies found that tooth size, arch length, irregularity index, arch width and crowding were comparable between digital and plaster-model measurements. A later review of 35 articles reported no significant differences for most parameters. One older clinical study found digital tooth-size and overbite values slightly smaller than manual ones, by 0.16 to 0.49 mm, which the authors judged clinically irrelevant.
Scanner accuracy supports this. In a published full-arch comparison, all tested intraoral scanners deviated by less than 100 µm. That figure is often used as the benchmark for clinically acceptable full-arch accuracy, though one 2025 study cautions that the acceptable limit depends on the indication.
Where the numbers weaken:
- Brackets. In 18 patients scanned with brackets in place, intercanine, intermolar and incisor widths matched plaster-derived models. The single exception was one lateral-incisor width, off by 0.05 mm.
- Posterior regions. In a 50-patient comparison of three scanners with alginate, discrepancies were larger in the molar and premolar regions than elsewhere.
- Upper intercanine width. One comparison of intraoral, digital and 3D models found everything clinically acceptable except this measurement.
- CBCT-derived models. A meta-analysis found significant differences for some tooth widths and for overall Bolton, and called maxillary arch perimeter clinically unacceptable. For model analysis, surface scans are the safer source than segmented CBCT.
Worked example: a Bolton calculation
The numbers below are illustrative, not a patient. Say the six upper anterior teeth measure 48.0 mm and the six lower anterior teeth measure 35.0 mm.
- Anterior ratio = 35.0 ÷ 48.0 × 100 = 72.9%.
- Bolton's mean is 77.2%, with a standard deviation of 1.65. Two standard deviations below the mean is 73.9%.
- 72.9% falls under that cut-off, so there is relative maxillary tooth excess.
- To reach 77.2% with 48.0 mm of upper teeth, the lower teeth would need about 37.1 mm. The shortfall is roughly 2 mm of lower tooth material.
That 2 mm matters in planning: it can show up as spacing in the lower arch, a larger overjet, or crowding in the upper arch. Interproximal reduction or restorative options then become part of the discussion.
Read these thresholds with care. Bolton derived his means from 55 cases of excellent occlusion. Using two standard deviations as the limit is a convention: for the overall ratio that means below 87.5% or above 95.1%, and for the anterior ratio below 73.9% or above 80.5%. One review found no evidence that crossing the 2 SD line carries clinical importance on its own. Apply the analysis in the permanent dentition, after the teeth have erupted.
Little's Irregularity Index on a digital model
Little's index measures crowding in millimetres: five displacements between the contact points of the six lower anterior teeth, summed. A score of 0 means perfect alignment. Published scales read 1–3 mm as minimal, 4–6 mm as moderate, 7–9 mm as severe and 10 mm or more as very severe.
On a digital model you can rotate the mesh and place each contact point from a true occlusal view. A comparison of space analysis on digital and plaster models reported intraclass correlations of 98.6 to 99.9% for both the irregularity index and total arch length discrepancy. The index does have a limit: it combines rotation and tilt into one number, so a high score does not tell you which movement is needed.
File formats: what your analysis software needs
Most orthodontic software opens STL, PLY and OBJ, so the choice comes down to colour, file size and mesh quality.
- STL stores a triangle mesh with no colour, texture or units. It is the common denominator, but a grey surface makes it harder to tell tooth from gingiva.
- PLY stores colour per vertex, which keeps the gingival margin and staining visible. In one file-comparison study, PLY files were 39 to 62% smaller than their STL equivalents, depending on whether colour was included.
- OBJ also carries colour and texture, but intraoral scanners mainly output simple triangular surfaces, so its extra geometry features go unused.
Exports differ by scanner. According to our own comparison, 3Shape TRIOS exports STL, PLY, DCM and .3oxz, while Medit i700 exports STL, PLY, OBJ and DICOM. See our guide to 3Shape TRIOS versus Medit i700 in orthodontic workflows.
Mesh quality matters more than format. The American Board of Orthodontics, which accepts digital models for part of its certification process, requires PLY, STL or OBJ files with a manifold, watertight mesh. Where a model has no base, it allows at most one hole, the boundary of the surface. Holes and non-manifold edges break segmentation and give wrong tooth widths, so check the mesh before you measure. Our STL file guide for orthodontic clinics covers the practical checks, including resolution and watertightness.
Superimposition: measuring change, not just state
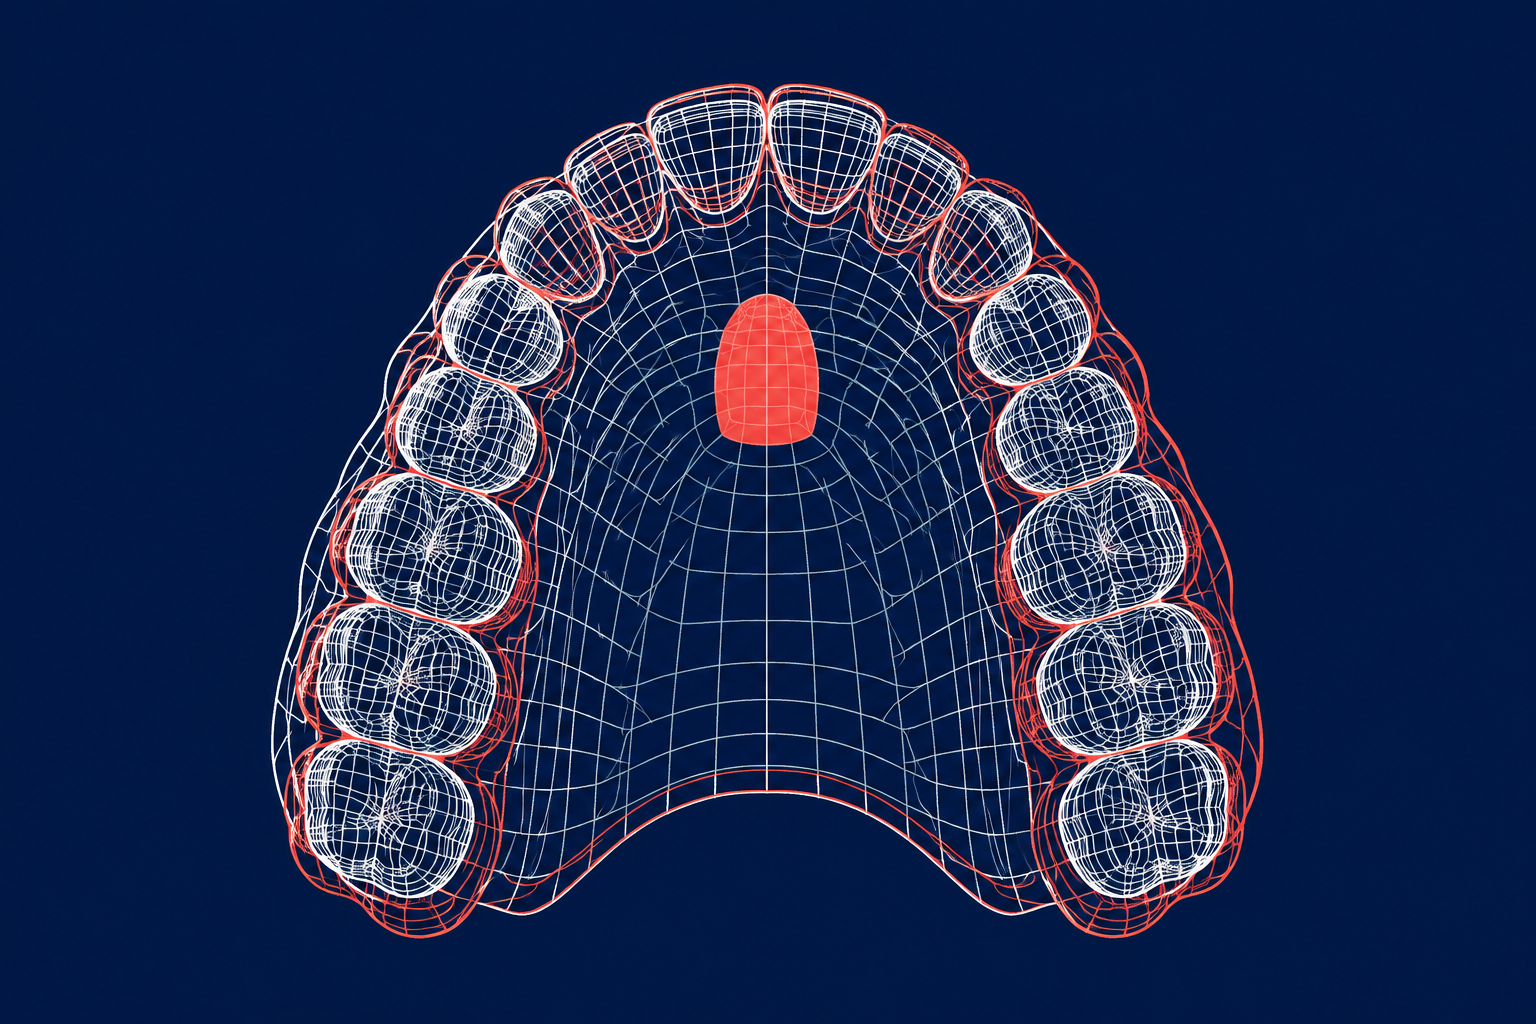
A single model gives you a snapshot. Two models from different time points, registered onto each other, show tooth movement as a colour-coded distance map. The registration only works if you anchor on structures that do not move.
For the maxilla, the medial two-thirds of the third palatal rugae (with a small area behind) is the reference area with the highest stability, and it served as the gold standard in a technique comparison. In another study of serial maxillary models, the choice of reference area was the only factor that changed the measurements, ahead of regular cast artifacts. Surface-based registration needs a reference selected on one model. Landmark-based registration requires you to identify corresponding landmarks on both models by hand.
In practice, decide the reference area before you start, and use the same one for every time point of the same patient.
Speed and automation: use it, but don't mix methods
In a study of 30 patients, combined Bolton and space analysis took less time on digital models than on plaster, with no significant difference in values.
Automation goes further. In a European Journal of Orthodontics study on 26 intraoral-scan records, manual digital analysis took 8.62 minutes on average and AI-based automatic analysis took 0.56 minutes. Repeated measurements were also more consistent with the automatic system. But the 12-tooth sum differed from manual measurement by 1.80 to 2.38 mm, and arch perimeter by 1.42 to 3.23 mm. The authors concluded that the two methods should not be interchanged, and the sample was limited to complete dentitions with mild-to-moderate crowding.
The rule that follows: pick one method per patient and stay with it across time points. If you want to see how AI is being applied to treatment planning more broadly, read our piece on AI and machine learning in orthodontic planning.
Where digital analysis falls short
- Landmark placement. Automated landmark localization on digital models showed errors from 0.01 to 1.68 mm, and for cusp tips and facial-axis points the AI errors exceeded the differences between human examiners.
- Mesh holes and gaps. Interproximal areas that were not captured leave holes in the mesh, and a width measured across a hole is a guess. Rescan before you analyse.
- Wrong tool for the question. Bolton and Pont-type analyses give you a prediction. They do not replace the clinical exam, a cephalometric analysis or your own judgement.
Handing the analysis to your lab
The model analysis is only as good as the data your lab receives. A workflow that works on our side at NordicDens: you export the scan as STL or PLY, check the mesh for holes, name the file so it links to the patient record (STL stores no patient metadata), and upload it with clinical photographs and a digital prescription through a secure portal. Our technicians then design the appliance in orthodontic CAD software on the same model you analysed, and you review the design before production. Our overview of the digital workflow from intraoral scan to appliance walks through each step, and the orthodontic CAD software comparison shows which platforms fit which tasks.
Your next step: take one recent scan, run the anterior Bolton ratio and Little's index on it, and check the mesh against the watertight criteria above. When a case is ready for an appliance, send it to NordicDens as an STL or PLY file with clinical photographs and a digital prescription, and our team will design on the same data you analysed.